WELL-ready indoor air quality monitoring for modern offices
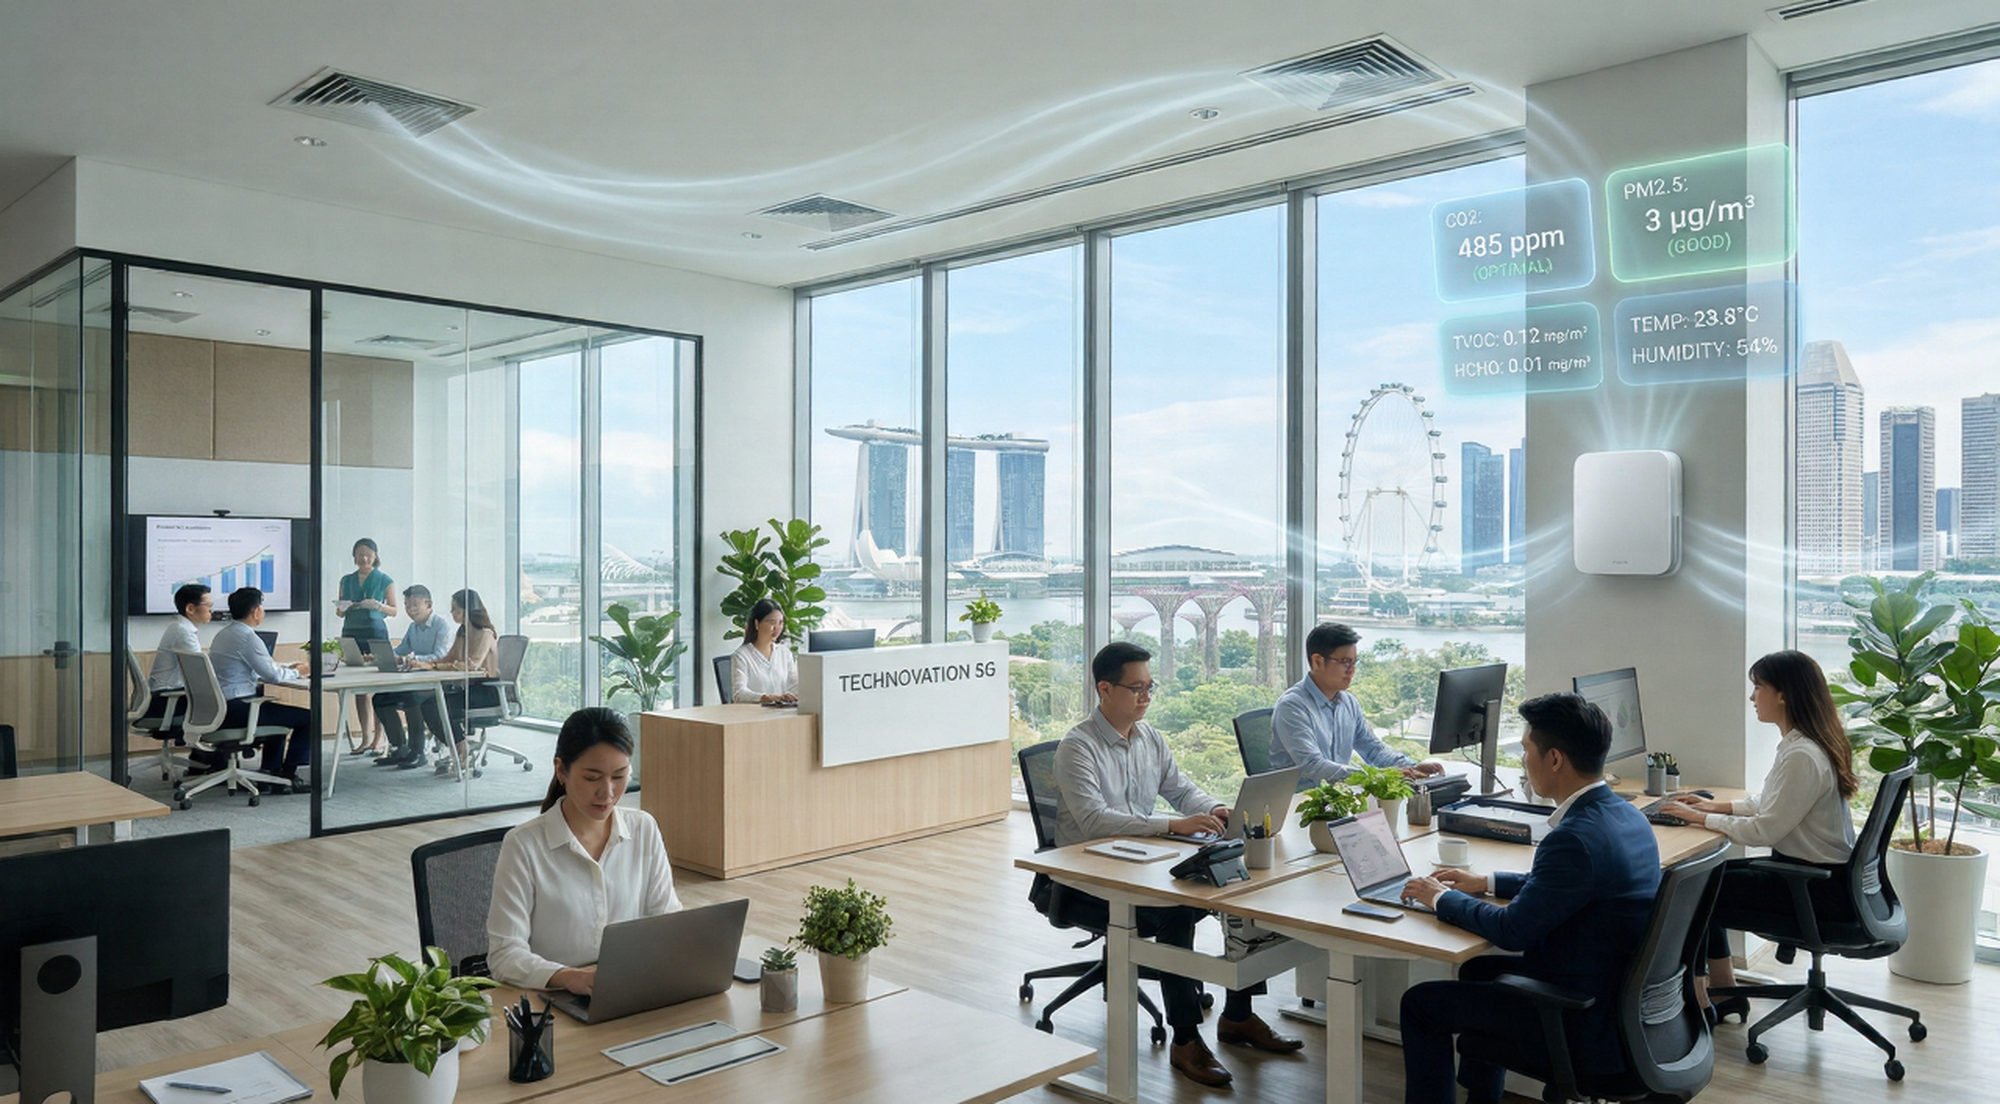
Track CO₂, PM2.5, TVOC, HCHO, temperature, and humidity in real time with the CU-606 IAQ sensor and a web portal built for facilities teams, ESG reporting, and healthier workplaces.
[Book a Demo] [Talk to Us]
Why this matters
Even in well-ventilated buildings, indoor air quality issues often go unnoticed until discomfort or complaints arise, productivity drops, or compliance questions appear.
Studies conducted in Singapore show that:
- IAQ performance varies across buildings and requires measured data across multiple factors, not assumptions based on ventilation design (PubMed)
- Air-conditioned spaces can experience significant fluctuations in CO₂ and VOC levels depending on usage and occupancy (ScienceDirect)
- Indoor pollutants such as VOCs originate from materials, ventilation systems, and occupant activities (ScienceDirect)
This means that even well-designed buildings do not guarantee consistent air quality.
Without continuous monitoring, these variations remain invisible.
One platform. Six critical IAQ parameters.
The CU-606 monitors the environmental signals that matter most in office spaces:
- CO₂ for ventilation effectiveness and occupancy impact
- PM2.5 for fine particulate exposure
- TVOC for emissions from materials and cleaning agents
- HCHO for formaldehyde monitoring (critical for certifications)
- Temperature for thermal comfort
- Humidity for environmental balance
Singapore standards already define thresholds—for example, CO₂ levels should typically remain below ~1100 ppm for acceptable indoor conditions (National Environment Agency).
The challenge is not defining limits.
The challenge is knowing when and where they are exceeded.
Built for offices and WELL-focused projects
Modern IAQ management requires:
- Continuous monitoring (not periodic checks)
- Multi-parameter visibility (not single sensors)
- Evidence-based reporting (not assumptions)
This solution is designed to support:
- WELL certification strategies
- Office workplace optimisation
- Facilities and operations teams
- ESG and sustainability reporting
What the web portal helps you do
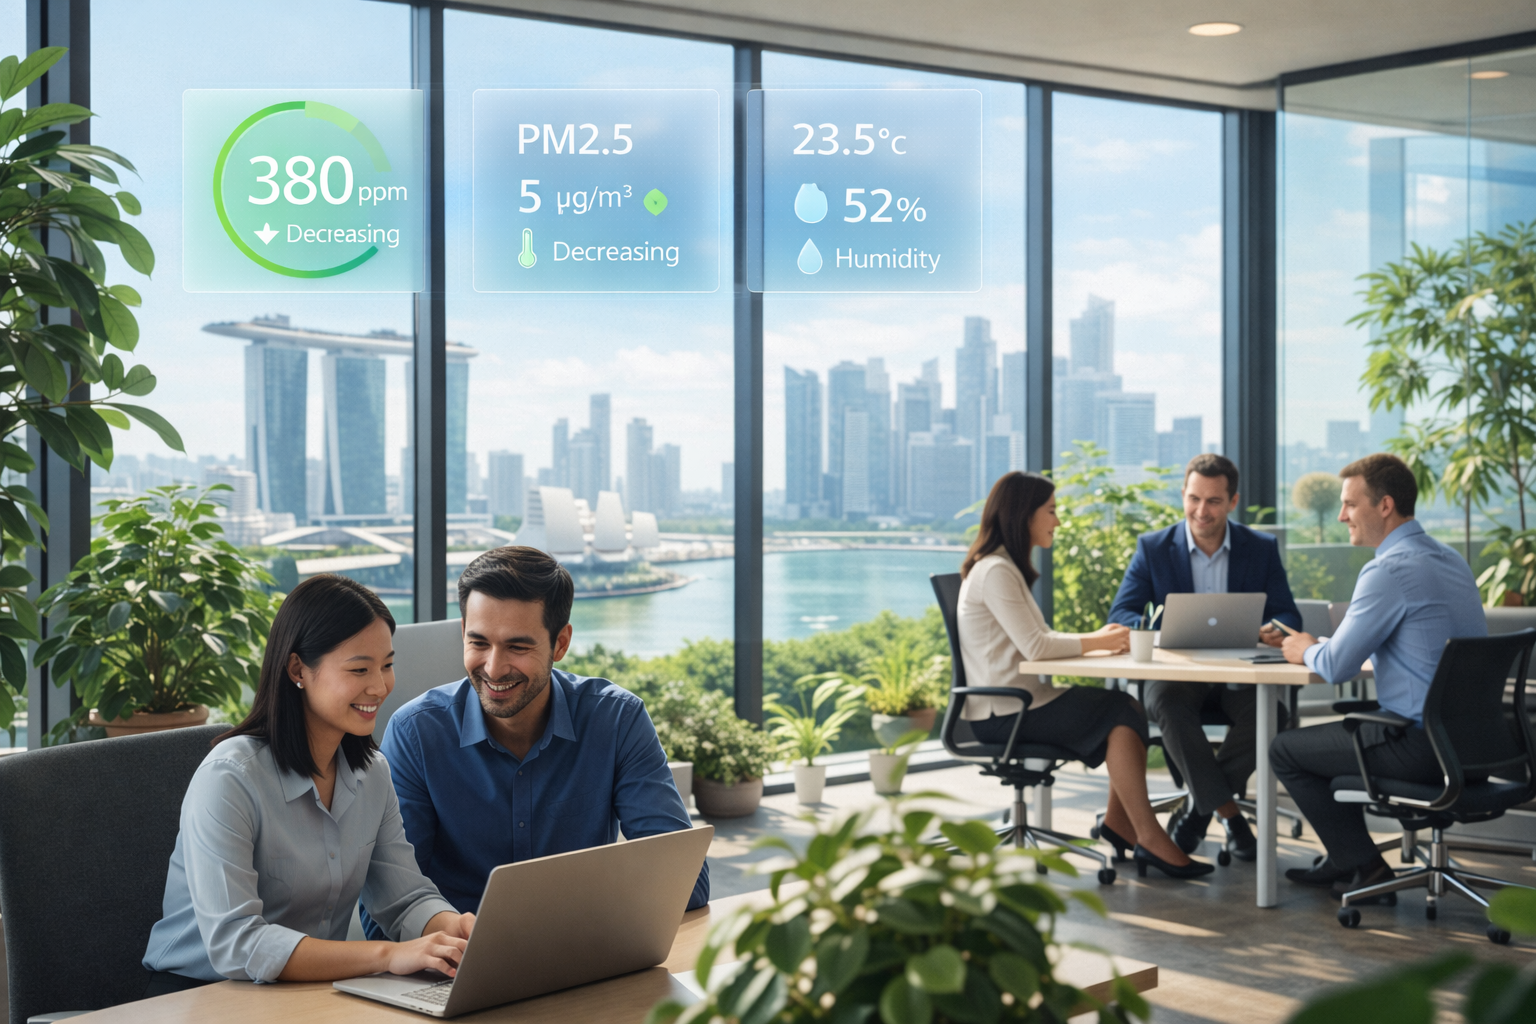
Real-time dashboard visibility
See current IAQ conditions across rooms and zones instantly. Identify issues before they escalate.
Threshold-based alerts
Respond early when CO₂, PM2.5, VOCs, or temperature move outside acceptable ranges.
Historical trends and analytics
Track patterns over time and support audits, reporting, and operational improvements.
Multi-site management
Monitor multiple offices from a single platform and standardise IAQ visibility.
Actionable reporting
Convert sensor data into clear insights for both technical teams and management.
Why monitoring is needed — even in good buildings
Singapore-based studies consistently show a clear pattern:
- Average conditions may look acceptable
Many buildings meet general IAQ guidelines most of the time (ScienceDirect)
- But fluctuations are common
CO₂ and VOC levels can spike significantly in enclosed or occupied spaces (ScienceDirect)
- Sources are dynamic
Pollutants come from real-world usage:
- Occupancy density
- Materials and furnishings
- Cleaning and daily operations (ScienceDirect)
- Impact is measurable
Local studies show improving IAQ (e.g. reducing VOCs) can improve cognitive performance by ~12% (Corporate NTU)
The implication
The risk is not “bad buildings.”
The real issue is:
Invisible variation in air quality that is not actively monitored or managed.
Why customers choose this solution
- Clear visibility, not assumptions
Replace periodic checks with continuous monitoring.
- Multi-parameter coverage
CO₂ alone is not enough—real IAQ requires multiple data points.
- Designed for real operations
Dashboards, alerts, and trends support daily facility management.
- Scalable deployment
LoRaWAN connectivity enables cost-effective monitoring across multiple zones and sites.
- Evidence for compliance and reporting
Supports WELL-related documentation and internal reporting needs.
Ideal applications
- Corporate offices
- Meeting rooms and enclosed spaces
- Open-plan workplaces
- Renovation and fit-out monitoring
- Schools, clinics, shared facilities
- WELL and green building projects
How it works
Step 1: Deploy CU-606 sensors
Install in key indoor zones.
Step 2: Connect to the platform
Data is transmitted for centralised monitoring.
Step 3: Monitor, alert, improve
Identify issues early and respond with confidence.
Use cases that matter
Meeting rooms with rising CO₂
Occupancy-driven spikes can occur quickly—even in well-ventilated buildings.
Fit-outs and renovations
VOC and formaldehyde emissions can increase after new materials are introduced.
Multi-zone offices
Different areas behave differently—averages hide real issues.
WELL-related monitoring
Continuous data supports certification and reporting requirements.
Product highlights
CU-606 6-in-1 IAQ Sensor
- Monitors CO₂, PM2.5, TVOC, HCHO, temperature, humidity
- LoRaWAN connectivity
- Compact wall/ceiling-mounted design
- High-precision sensing
Web Portal
- Real-time IAQ dashboard
- Multi-site visibility
- Alerts and thresholds
- Historical analytics
- Operational insights
The business value
A strong IAQ monitoring system enables:
- Better workplace comfort
- Faster response to environmental issues
- Improved decision-making
- Stronger compliance and reporting
- Increased confidence from occupants and stakeholders
Ready to make IAQ visible?
Move beyond assumptions and periodic checks.
Deploy the CU-606 IAQ sensor with a web platform built for real operational use, and gain continuous visibility into your indoor environment.
[Book a Demo] [Request a Consultation]