Footfall Analytics: 5 Proven Metrics for Measuring Real Campaign Impact
What Footfall Analytics Data to Extract Per Campaign
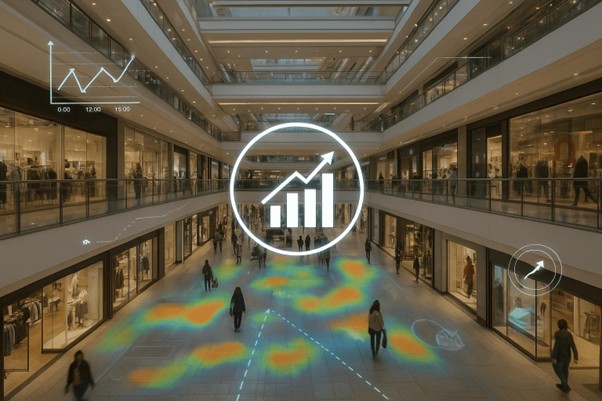
Footfall analytics gives mall operators and tenants the ability to quantify exactly how much events like CNY, Year-End Sales, or Holiday Promotions actually drive traffic — per location, per shop.
The problem:
No one can quantify how much they actually work—per location, per shop.
This is where a campaign framework becomes powerful.
- Define Campaign as a Data Layer (Not Just a Label)
A campaign should not just be:
“Start date → End date”
That’s too basic and leads to weak insights.
Instead, define campaign with structure:
Campaign Object (Recommended)
- Name
- e.g. “CNY 2026”, “Year-End Sale 2025”
- Time Window
- Start date / End date
- Campaign Type
- Festive (CNY, Christmas)
- Retail Promotion (Discounts)
- Mall Event (Roadshow, exhibition)
- Scope
- Mall-wide
- Zone-specific
- Shop-specific
- Baseline Period (Critical)
- Automatically assign:
- Previous 2–4 weeks (weekday matched)
- Same period last year (if available)
- Automatically assign:
👉 Without a baseline, your “comparison” is statistically weak.
- What Footfall Analytics Data to Extract Per Campaign
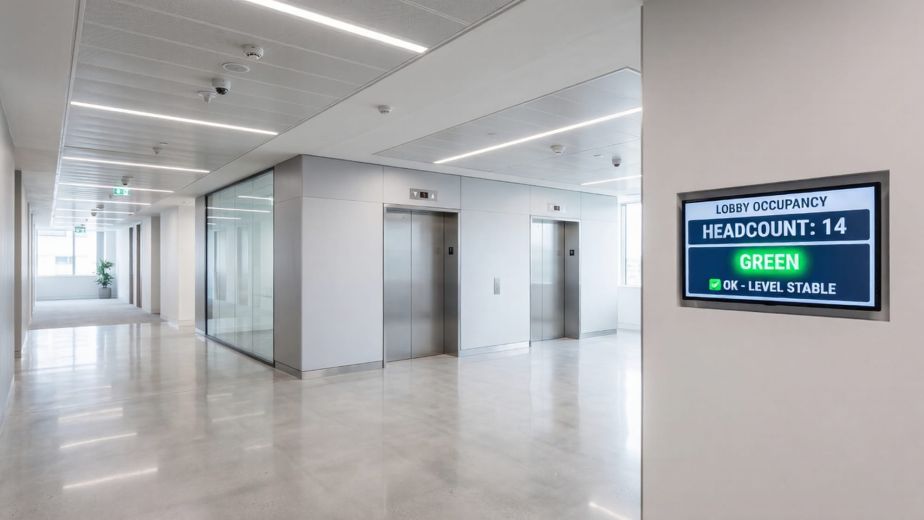
From Milesight VS125 (passerby + entry), you should extract:
Core Metrics
- Total Passersby
- Total Entrants
- Capture Rate (%)
- Entrants / Passersby
- Peak Hour Distribution
- Dwell Time (if enabled)
- The Comparison That Actually Matters
Most people will compare:
“Campaign A vs Campaign B”
That’s misleading unless normalized.
Instead, use this hierarchy:
- Campaign vs Baseline (Most Important)
- Did traffic increase vs normal period?
- Did conversion improve?
Example:
- Passersby: +20%
- Entrants: +10%
→ Conversion dropped → campaign attracted traffic, but not buyers
- Campaign vs Same Campaign Last Year
- Removes seasonality bias
Example:
- CNY 2026 vs CNY 2025
→ Real growth indicator
- Cross-Location Comparison
- Which shop/location benefited most?
Example:
- Shop A: +30% entry
- Shop B: +5% entry
→ Location or storefront effectiveness issue
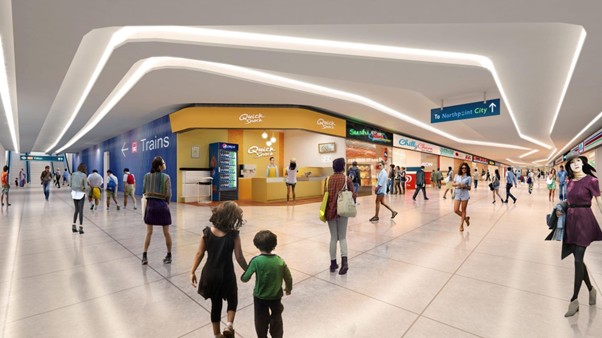
- Underground Mall Insight (This is your edge)
Campaign impact behaves very differently underground:
Weekday Campaign Effect
- Traffic mostly fixed (commuters)
- Campaign must convert, not attract
Weekend / Holiday Effect
- Traffic is elastic
- Campaign can increase both passersby and entry
👉 This distinction is often missed—and it’s where your platform can differentiate.
- Rental & Leasing Implications (High-value angle)
With campaign analytics, landlords can:
a. Measure “Event Sensitivity” per Location
- Some zones respond strongly to campaigns
- Others are “transit-only”
b. Justify Rental Premiums
- Not just based on location
- But based on campaign uplift performance
c. Sell Campaign Slots (New Revenue Stream)
- Charge tenants for:
- High-performing campaign periods
- High-conversion zones
- F&B Operational Planning (Immediate ROI)
For restaurants:
Before Campaign
- Predict expected uplift using historical campaigns
During Campaign
- Adjust:
- Inventory
- Staffing
- Prep timing
After Campaign
- Evaluate:
- Did higher traffic translate to higher entry?
- Was kitchen capacity sufficient?
- What Most Footfall Analytics Systems Get Wrong (You Should Avoid)
Let’s be blunt—these are common failures:
- No Baseline Comparison
→ Leads to false conclusions
- Aggregated Mall-Level Data Only
→ Useless for tenants
- Ignoring Passersby vs Entry
→ Cannot measure conversion
- No Time Segmentation
→ Peak vs off-peak lost
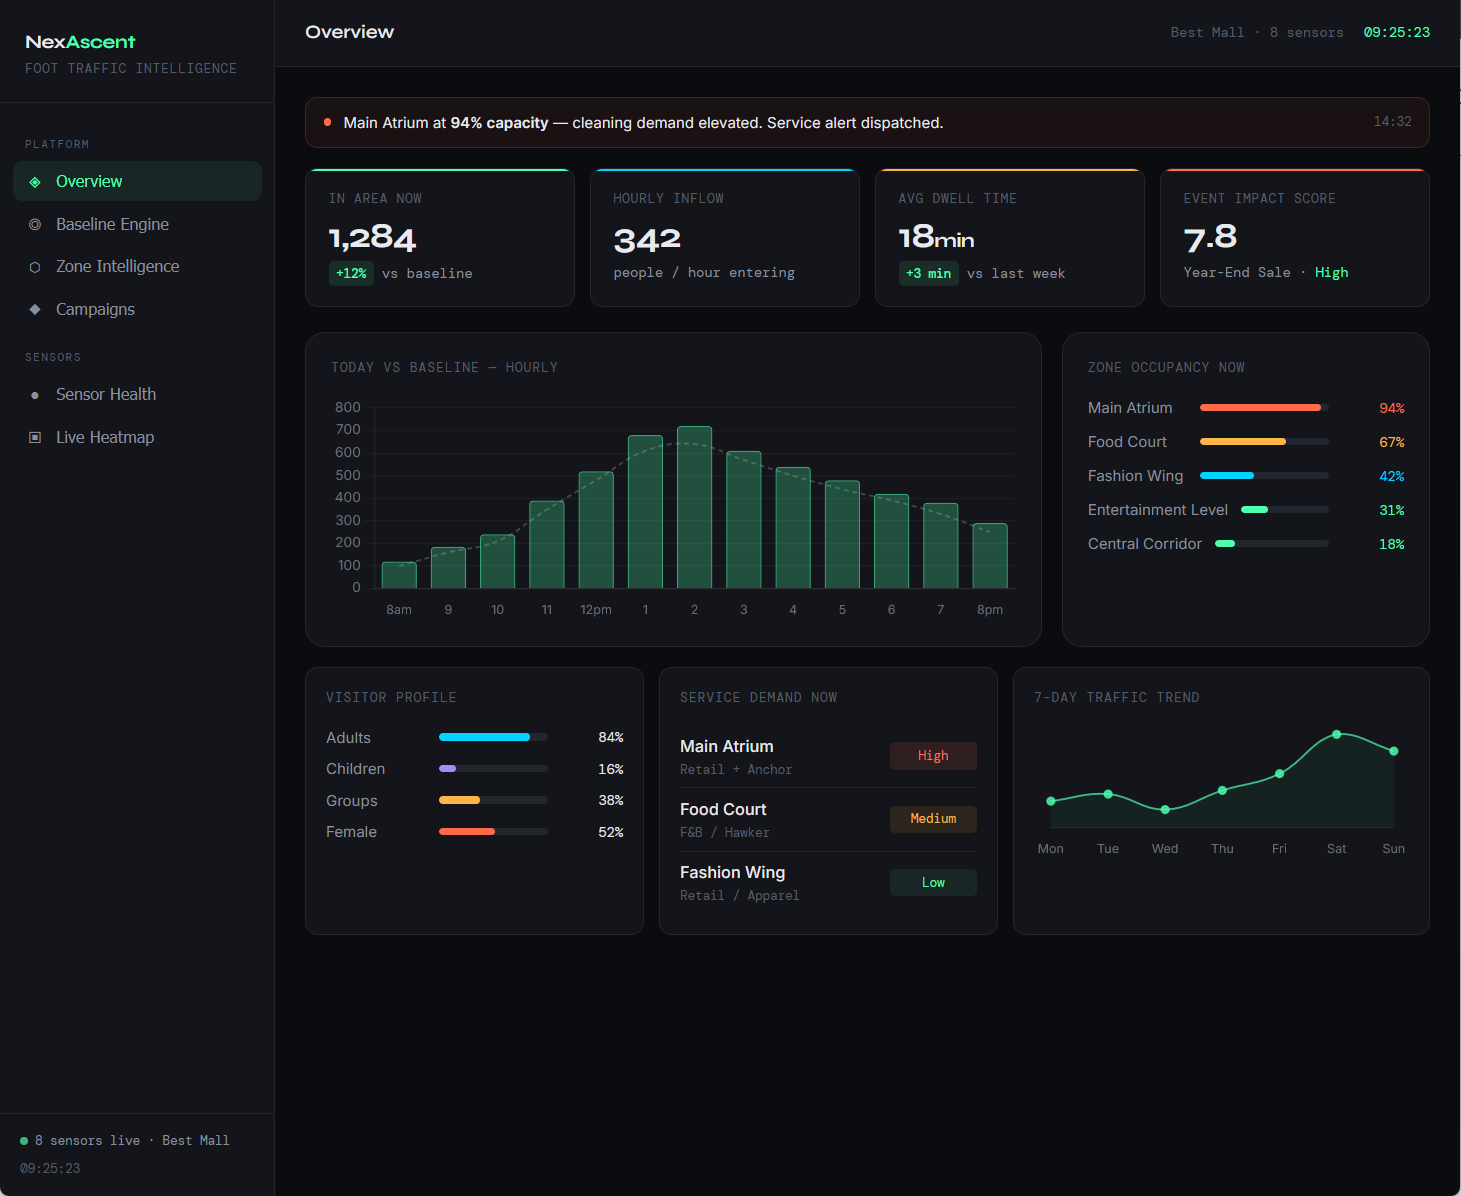
- Recommended Dashboard Structure for Footfall Analytics
For each campaign:
Summary Panel
- Total Passersby
- Total Entrants
- Capture Rate
- % Change vs Baseline
Trend View
- Hourly traffic curves
- Weekday vs Weekend split
Location Comparison
- Shop-by-shop performance
Insight Layer (important for differentiation)
Auto-generated insights like:
- “Traffic increased, but conversion dropped”
- “Weekend uplift significantly higher than weekday”
Bottom Line
What you’re proposing is not just reporting—it’s:
A system to quantify the real commercial impact of events.
If implemented properly, it directly supports:
- Rental pricing decisions
- Tenant performance evaluation
- Campaign ROI measurement
- Operational planning (especially F&B)
Strategic Recommendation (Priority Order)
- Build baseline comparison first
→ Without this, everything else is weak - Separate passersby vs entry clearly
→ This is your core differentiator - Standardize campaign templates
→ Avoid messy, inconsistent data - Add automated insights (not just charts)
→ This is what makes it “sellable”
Check out the dashboard for footfall analytics here: Click here
Foot traffic intelligenceNexAscent have other solutions that could be deployed immediately to gather data and generate insights.
Read about People counting solutions for institute of higher learnings to optimize ACMV and lighting.